


Illustration: How to read and understand a chart
Charts represent a key element in the activity of trading and in understanding the stock exchange in general.
There are two types of analysis – technical and fundamental. In the former, analysing charts is the essential first step for any analyst or trader. There are many chart-linked theories, the Elliott wave, for example. There is, in fact, a whole sector dedicated to reading and understanding stock market value charts. Many technical indicators are based on these same charts. And of course, let’s not forget that some famous traders have made their fortune by using only chart analysis, proving how sensible it is to take a keen interest in this type of analysis.
What exactly is a chart?
A chart is simply a graphical representation of a series of prices over time, from a time in the past to the current time. What is important to bear in mind is that the chart information is actual a history, a simple visual representation of what happened in the past. In short, a chart is as basic as it gets! Yet very clever use of this tool can give a trader a definite advantage and to do that, a trader requires knowledge of some basic notions.
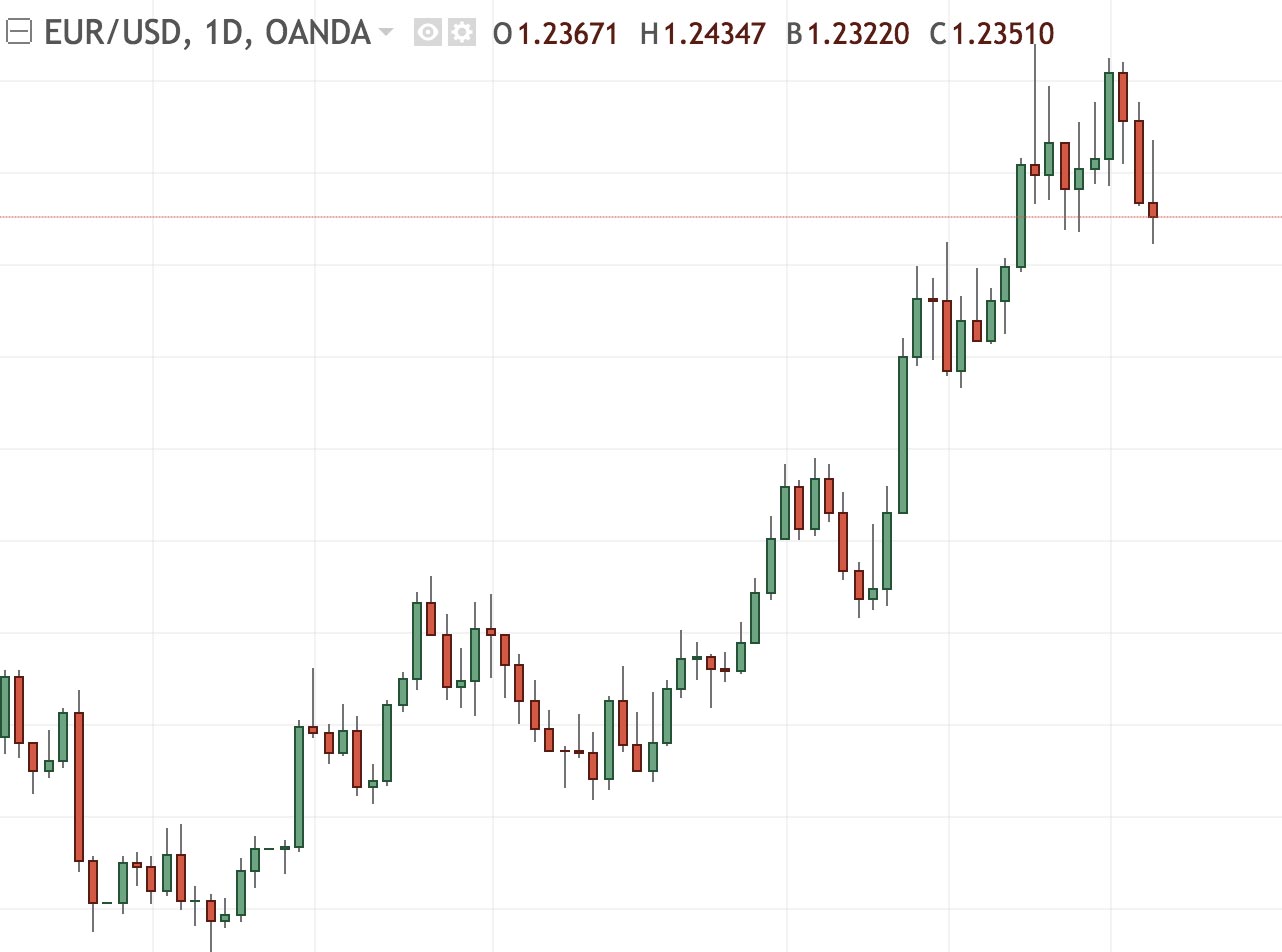
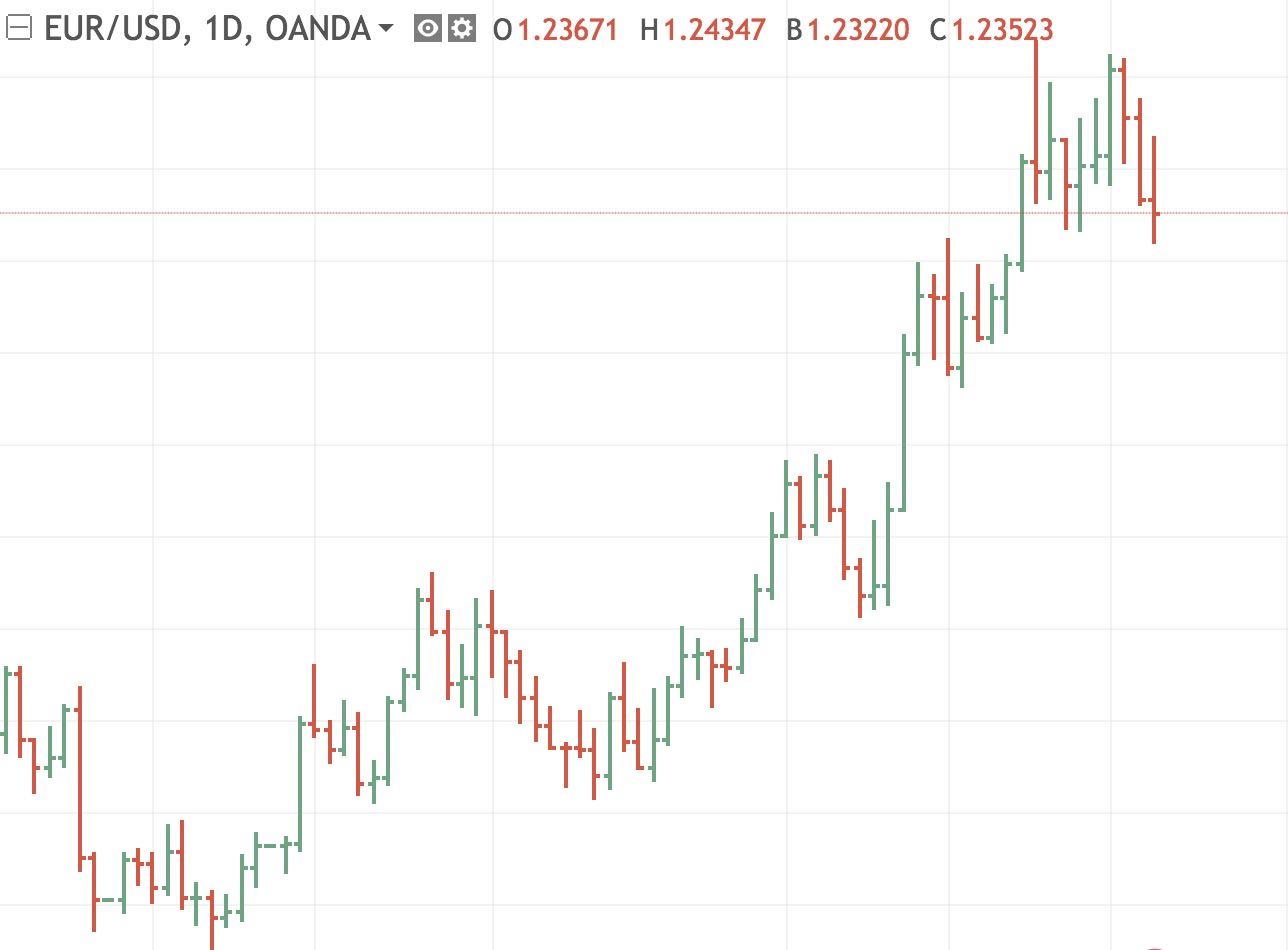
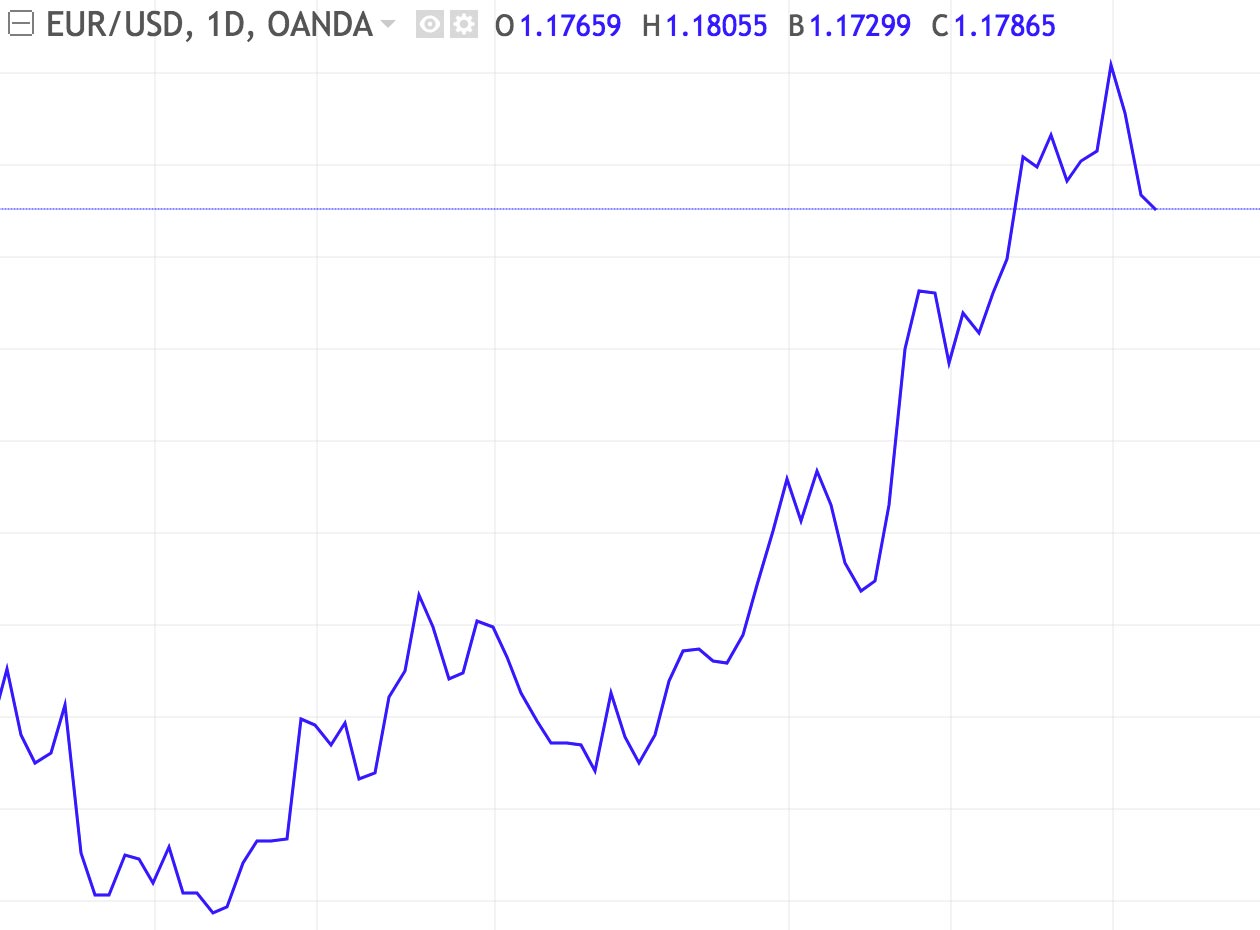
The first visual element of a graph comes from its very aesthetics, from the way it is drawn. When talking about charts, we say there are different types: line charts, candlestick charts (also known as Japanese candlestick charts), bar charts, area charts… Each chart type has its own visualisation which, beyond the simple visual aspect, also provides information that is adapted to different strategies. For example, candlestick and bar charts indicate the highs and lows during a set period, which line and area charts cannot show. Colours also make it possible to visualise whether a value has gone up or down during a chosen period.
“OHLC” can often be seen on charts: Open High Low Close charts show open, high, low, and closing prices over one unit of time.
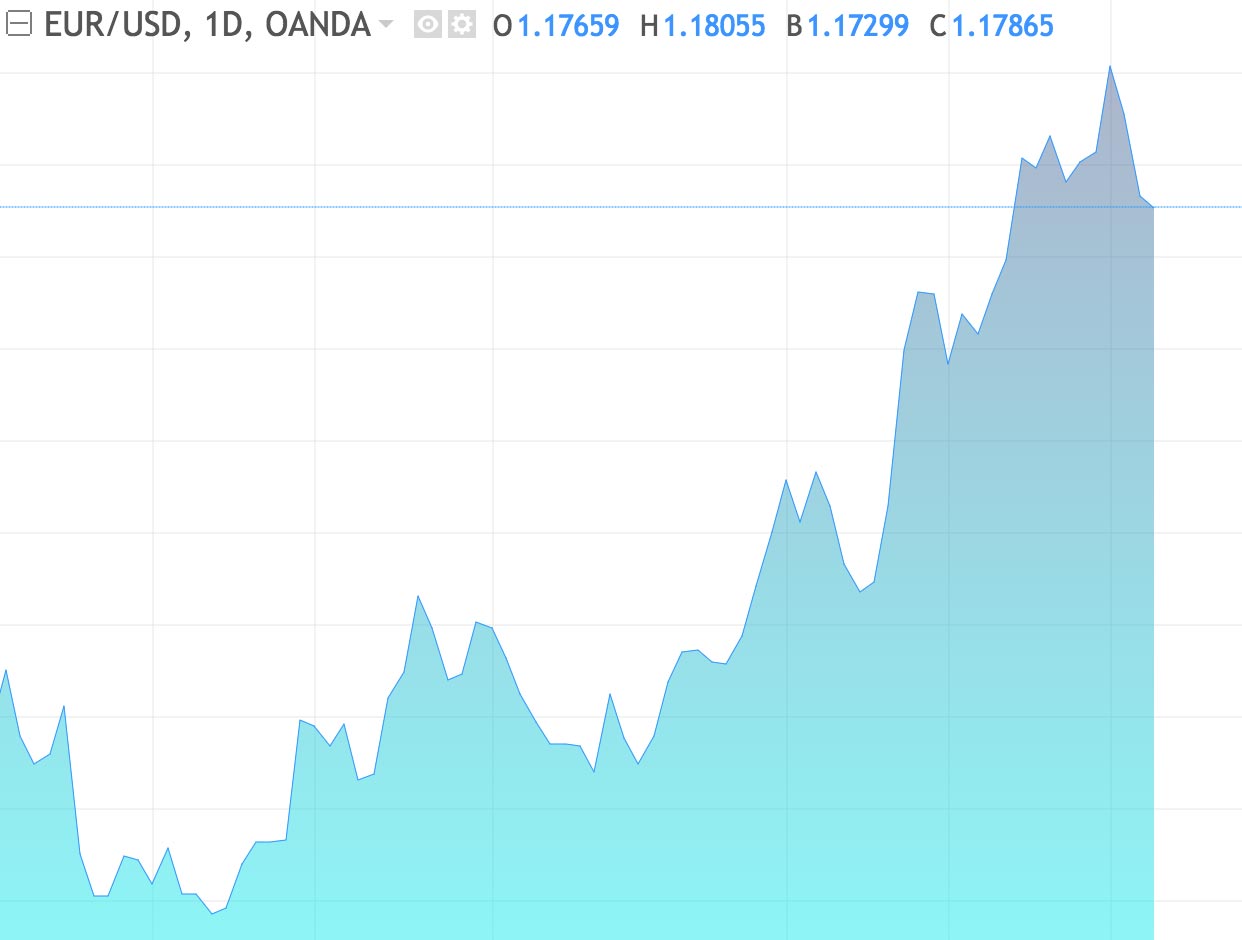
Different types of charts on EUR/USD : ( Click on an image to zoom in )
Another crucial element of reading a chart is the timescale or unit of time used. We can zoom in or out to see the precise price history we are interested in, from one minute to one year. The abbreviations are: 1m (1 minute), 1H (1 hour), 4H (4 hours), 1D (daily), 1W (weekly), 1M (monthly), 1Y (yearly).
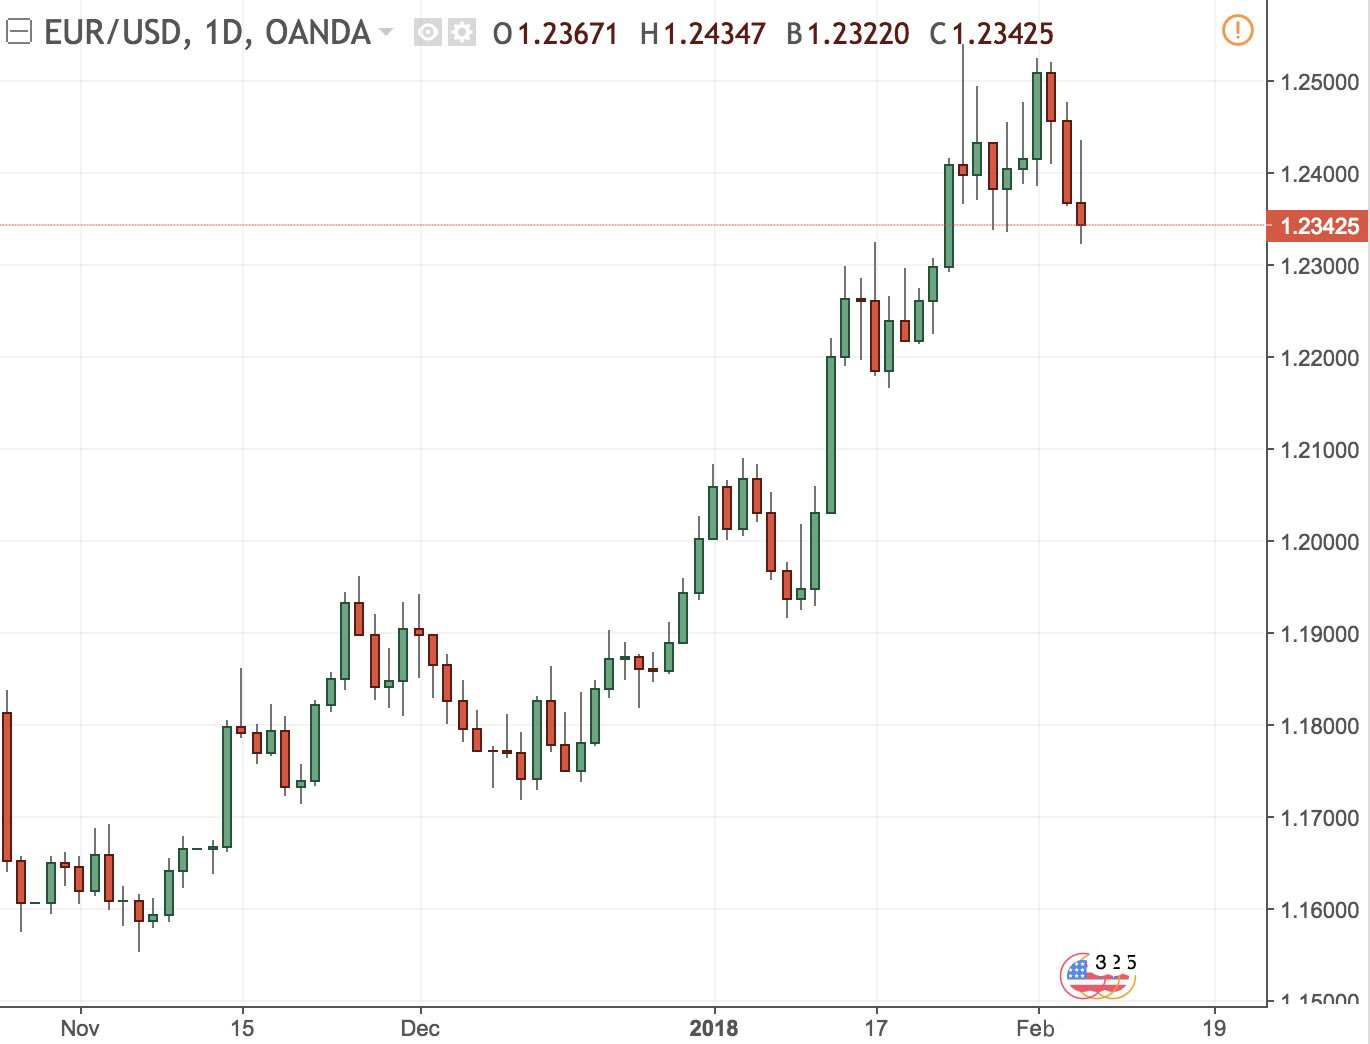
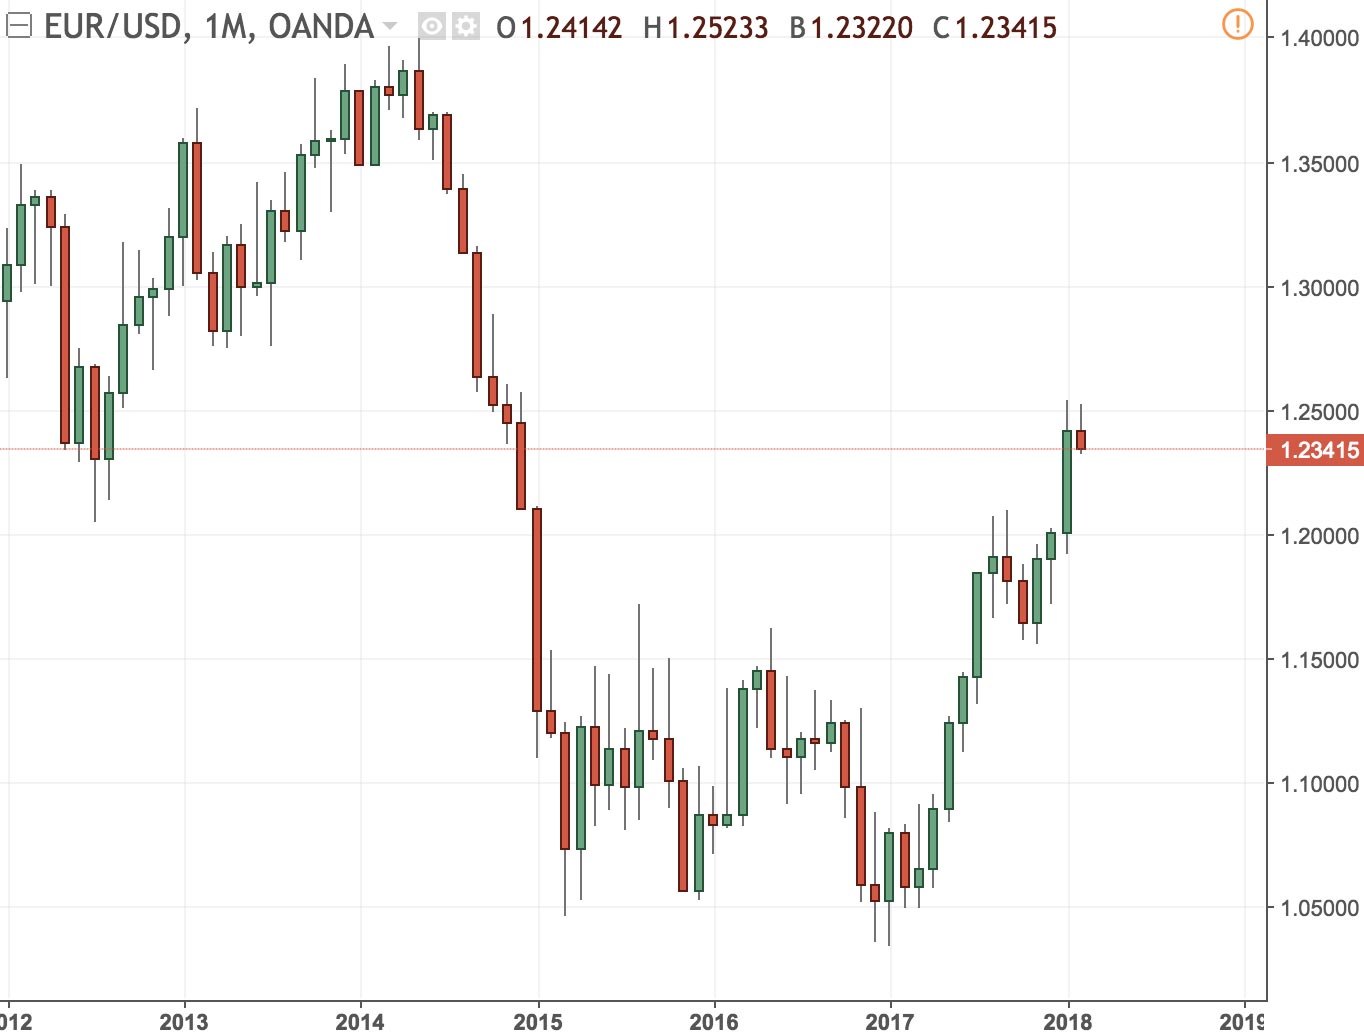
Different timescales on EUR/USD : ( Click on an image to zoom in )
These timescales make it possible to detect major trends, for swing trading, for example, or to find good entry points for short-term trading or day-trading.
Our selection of verified and recommended brokers:
Here are the brokers that our experts have rigorously hand-picked and verified to help guide you towards your financial goals with confidence and peace of mind.
Quality customer service 🏆
Advantages
Minimum deposit: £0
Spreads: 0.5 pip on S&P 500, 1 pip on FTSE 100, 1 pip on CAC 40
Open and close your positions 24/5
Trading simulator with £10,000 virtual funds
Integration with TradingView and ProRealTime
Over 50 years of expertise
Recommended broker 🏆
Advantages
Min deposit: £10
Spreads: 0.1 pip on eur/usd and eur/gbp, 0.3 pip for the sp500 and 0.8 pip for the FTSE 100
Buy shares and ETFs with no commission
Online courses for investors of all levels
Demo account with £20,000 virtual funds
Ultra-low spreads 🏆
Advantages
Minimum deposit: £0
Spreads: 0.5 pip on EUR/USD, 0.45 pip on FTSE 100 and 0.8 pip on EUR/GBP and EUR/CHF
Over 20 years of experience
Fund protection up to 1 million GBP
Ultra-competitive spreads
Advanced chart analysis with TradingView
There are also dozens of chart shapes or patterns that can help traders optimise their strategies and risk management. The most well-known are support and resistance, head and shoulders, double bottom, double top, ascending triangle, descending triangle. It is essential to study all of these and understand them thoroughly.
Technical indicators are also based on past values and are used in conjunction with charts. Some names are MACD, RSI, Bollinger bands, Fibonacci indicators, Ichimoku Clouds… and the list goes on. You don’t need to know them inside out but understanding when and how they can be used can be helpful.
Value of chart analysis
As mentioned previously in this article, chart analysis has made some people millionaires. Why is this analysis so powerful? In fact, it mirrors the sentiment and behaviour of investors. Humans tend to repeat their past behaviours; faced with the same event, they will react to it in the same way. And this phenomenon is all the more true as they are reacting to a substantial number of occurrences. As a result, past fluctuations and reactions tend to be reproduced in the markets. Hence the power behind technical analysis, behind chart analysis: in the presence of a particular shape or the level of certain indicators, it is possible to “predict” what happens next based on past events. From a philosophical point of view, this is rather depressing, as it means humans never learn from their experience and continue to make the same mistakes. But it’s good news for traders, who can use this psychology to possibly make a profit.
Conclusion
Charts are effective trading tools. For this reason, they need to be used with extreme care. As is so often the case in this area, they represent a double-edged sword, which is why analysing, studying and understanding charts need to form the basis of some initial, extremely rigorous training. More so, in fact, when you understand that basing your trading exclusively on chart analysis can be a dangerous thing to do. It certainly can’t do any harm to also have some knowledge of fundamental analysis. In any case, whatever type of trading you do, nothing is more effective than good capital and risk management, the closest thing you’ll get to a guarantee of success.


